Top Ramen Beef Flavor
Packaged product Soups and Sauces Nissin
Top Ramen Beef Flavor contains 452 kcal per 100 g. A serving, 85 g (85 g) provides about 384 kcal.
Roughly 57% of its calories come from carbohydrates, with 33% from fat and 10% from protein (estimated with general energy factors).
That is more energy than the typical item in soups and sauces on FoodFactly, where the median is 400 kcal per 100 g across 29 products.
100 g provides 36% of the Daily Value for iron.
The values are label data submitted by the manufacturer to USDA FoodData Central.
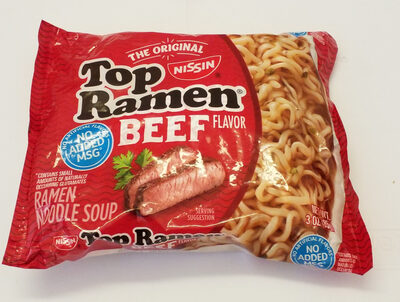
Nutrition facts
| Nutrient | Amount per 100 g | % DV |
|---|---|---|
| Calories L | 452 kcal | |
| Total fat L | 16.7 g | 21% |
| Saturated fat L | 8.3 g | 42% |
| Trans fat L | 0 g | |
| Cholesterol L | 0 mg | 0% |
| Sodium L | 1,810 mg | 79% |
| Total carbohydrates L | 64.3 g | 23% |
| Dietary fiber L | 4.8 g | 17% |
| Total sugars L | 0 g | |
| Added sugars L | 0 g | 0% |
| Protein L | 11.9 g | 24% |
| Vitamin A L | 0 µg | 0% |
| Vitamin C L | 0 mg | 0% |
| Vitamin D L | 0 µg | 0% |
| Calcium L | 0 mg | 0% |
| Iron L | 6.4 mg | 36% |
| Potassium L | 200 mg | 4% |
% DV: percent of the FDA Daily Value for adults (reference amounts). Letters show how each value was obtained: M measured, C calculated, L label, Z assumed zero, I imputed. Vitamins and minerals not listed were not reported by the source.
Nutritional breakdown
- Protein 10%
- Carbohydrates 57%
- Fat 33%
Approximate share of calories, using general energy factors (4 kcal/g protein and carbohydrate, 9 kcal/g fat, 7 kcal/g alcohol).
Vitamins and minerals, % Daily Value per 100 g
Nutritional insights
- Protein11.9 gin the top quarter of soups and sauces (median 8.5 g)
- Fiber4.8 gin the top quarter of soups and sauces (median 2.7 g)
- Sugars0 gin the lowest quarter of soups and sauces (median 4.3 g)
- Fat16.7 gabove the median for soups and sauces (median 15 g)
- Saturated fat8.3 gin the top quarter of soups and sauces (median 6.5 g)
- Sodium1,810 mgabove the median for soups and sauces (median 1,350 mg)
- Protein per 100 kcal2.6 gprotein density, useful for comparing foods with different calorie levels
Full nutrient profile
Fats and cholesterol (2)
| Monounsaturated fat L | 7.1 g |
|---|---|
| Polyunsaturated fat L | 0 g |
Values by source
More than one dataset describes this food. FoodFactly keeps each source's values separately instead of blending them. The headline values above come from USDA FoodData Central: Branded Foods.
| Per 100 g | Open Food Facts | USDA Branded |
|---|---|---|
| Calories | 447 kcal | 452 kcal |
| Protein | 10.6 g | 11.9 g |
| Carbohydrates | 63.5 g | 64.3 g |
| Fat | 16.5 g | 16.7 g |
| Fiber | 2.4 g | 4.8 g |
| Sugars | 0 g | 0 g |
| Sodium | 1,565 mg | 1,810 mg |
Product details
- Brand
- Nissin
- Barcode
- 0070662010020
- Quantity
- 3 oz
- Label serving
- 85 g
- Category
- Ramen Soup
- NOVA group
- 4 processing level (1 to 4), as classified by Open Food Facts
Ingredients
Enriched flour (wheat flour, niacin, reduced iron, thiamine mononitrate, riboflavin, folic acid), palm oil, salt, contains less than 2% of autolyzed yeast extract, baker's yeast extract, beef fat, caramel color, corn syrup, dextrin, disodium guanylate, disodium inosinate, dried leek flake, garlic powder, hydrolyzed corn protein, hydrolyzed soy protein, maltodextrin, monosodium glutamate, onion powder. potassium carbonate, powdered beef, sodium alginate, sodium carbonate, sodium tripolyphosphate, soy sauce (wheat, soybean, salt, water), spice, sugar. tbhq (preservative).
As listed on the package and transcribed by Open Food Facts contributors. Always check the package for allergens.
Ingredient guides: Palm oilSaltYeastGarlicOnionSugarWheat flour
Similar products
| Food | Calories | Protein | Carbs | Fat |
|---|---|---|---|---|
| Ramen Noodle Soup Maruchan Instant Lunch Hot & Spicy Chicken Flavor | 453 | 10.9 g | 60.9 g | 17.2 g |
| Thai Coconut Curry Chicken Flavor Ramen Noodle Soup Top Ramen | 449 | 10.3 g | 63.2 g | 16.9 g |
| Carbonara Buldak Spicy Ramen Artificial Spicy Chicken Flavor Buldak | 448 | 7.6 g | 61.9 g | 17.1 g |
| Ramen Noodle Soup Nissin | 447 | 11.8 g | 61.2 g | 16.5 g |
| Ramen Firewok Scorchin' Sesame Shrimp Flavor hot and spicy Nissin | 446 | 10.8 g | 58.5 g | 20 g |
| Wonton Ramen Noodle Soup Maruchan | 458 | 8.6 g | 54.4 g | 22.9 g |
| Wonton ramen noodle soup - hot & spicy chicken flavor Maruchan | 459 | 10.8 g | 54.1 g | 21.6 g |
| Hot & Spicy Chicken Flavor Ramen Noodle Soup Nissin | 468 | 8.5 g | 57.4 g | 23.4 g |
Per 100 g. Calories in kcal. n/a: not reported by the source.
Source of the nutrition information
- USDA FoodData Central: Branded Foods, record 2680161. License: CC0 1.0 (U.S. public domain). Source record dated September 7, 2019. Imported November 6, 2026.
- Open Food Facts, record 0070662010020. License: ODbL 1.0 (Open Food Facts). Source record dated July 6, 2026. Imported November 6, 2026.
Last updated: . Data quality score: 100/100 (how it is calculated).
General nutrition information, not medical advice. Individual needs differ; see our disclaimer.