mini Nilla Wafers
Packaged product Sweets and Desserts Nilla
Mini Nilla Wafers contains 467 kcal per 100 g. A serving, 20 wafers, 30 g (30 g) provides about 140 kcal.
Roughly 59% of its calories come from carbohydrates, with 38% from fat and 3% from protein (estimated with general energy factors).
That is close to the median for sweets and desserts on FoodFactly (464 kcal per 100 g).
100 g provides 19% of the Daily Value for iron.
The values are label data submitted by the manufacturer to USDA FoodData Central.
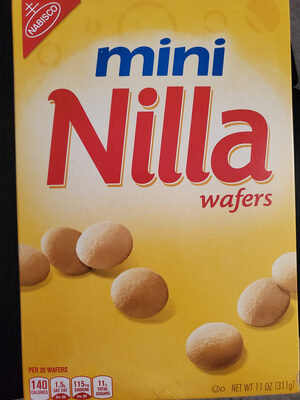
Nutrition facts
| Nutrient | Amount per 100 g | % DV |
|---|---|---|
| Calories L | 467 kcal | |
| Total fat L | 20 g | 26% |
| Saturated fat L | 5 g | 25% |
| Trans fat L | 0 g | |
| Cholesterol L | 17 mg | 6% |
| Sodium L | 383 mg | 17% |
| Total carbohydrates L | 70 g | 25% |
| Dietary fiber L | 0 g | 0% |
| Total sugars L | 36.7 g | |
| Added sugars L | 33.3 g | 67% |
| Protein L | 3.3 g | 7% |
| Vitamin C L | 0 mg | 0% |
| Vitamin D L | 0 µg | 0% |
| Choline L | 0 mg | 0% |
| Calcium L | 52 mg | 4% |
| Iron L | 3.4 mg | 19% |
| Potassium L | 83 mg | 2% |
% DV: percent of the FDA Daily Value for adults (reference amounts). Letters show how each value was obtained: M measured, C calculated, L label, Z assumed zero, I imputed. Vitamins and minerals not listed were not reported by the source.
Nutritional breakdown
- Protein 3%
- Carbohydrates 59%
- Fat 38%
Approximate share of calories, using general energy factors (4 kcal/g protein and carbohydrate, 9 kcal/g fat, 7 kcal/g alcohol).
Vitamins and minerals, % Daily Value per 100 g
Nutritional insights
- Protein3.3 gin the lowest quarter of sweets and desserts (median 6.5 g)
- Fiber0 gin the lowest quarter of sweets and desserts (median 3 g)
- Sugars36.7 gin the top quarter of sweets and desserts (median 26.8 g)
- Fat20 gabove the median for sweets and desserts (median 19 g)
- Saturated fat5 gbelow the median for sweets and desserts (median 7.6 g)
- Sodium383 mgin the top quarter of sweets and desserts (median 244 mg)
- Protein per 100 kcal0.71 gprotein density, useful for comparing foods with different calorie levels
Full nutrient profile
Sugars and starch (1)
| Starch L | 0 g |
|---|
Values by source
More than one dataset describes this food. FoodFactly keeps each source's values separately instead of blending them. The headline values above come from USDA FoodData Central: Branded Foods.
| Per 100 g | Open Food Facts | USDA Branded |
|---|---|---|
| Calories | 467 kcal | 467 kcal |
| Protein | 3.3 g | 3.3 g |
| Carbohydrates | 70 g | 70 g |
| Fat | 20 g | 20 g |
| Fiber | 0 g | 0 g |
| Sugars | 36.7 g | 36.7 g |
| Sodium | 383 mg | 383 mg |
Product details
Ingredients
unbleached enriched flour (wheat flour, niacin, reduced iron, thiamine mononitrate vitamin b1, riboflavin vitamin b2, folic acid), sugar, vegetable oil (soybean and/or canola and/or palm and/or partially hydrogenated cottonseed oil), high fructose corn syrup, whey (from milk), eggs, salt, leavening (baking soda, calcium phosphate), emulsifiers (mono - and diglycerides, soy lecithin), artificial flavor, natural flavor,
As listed on the package and transcribed by Open Food Facts contributors. Always check the package for allergens.
Ingredient guides: Wheat flourSugarEggSaltPalm oil
Similar products
| Food | Calories | Protein | Carbs | Fat |
|---|---|---|---|---|
| Taralucci Barilla | 467 | 7 g | 70 g | 17 g |
| 5-Grain Digestive High Fibre Sunfeast Farmlite | 467 | 8.3 g | 67.4 g | 20 g |
| Bastoncini Balocco | 467 | 6.4 g | 69 g | 18 g |
| Galletti shortbread cookie with sugar crystals Barilla | 467 | 6.7 g | 70 g | 20 g |
| Chocolate Brownie Sweet Thins Simple Mills | 467 | 6.7 g | 63.3 g | 23.3 g |
| Wegmans, chocolate sandwich creme cookie Wegmans | 467 | 3.3 g | 73.3 g | 20 g |
| The bakery, message heart sugar cookies The Bakery | 467 | 6.7 g | 70 g | 20 g |
| Double Chocolate Brownie Mini Cookies HighKey | 467 | 16.7 g | 36.7 g | 40 g |
Per 100 g. Calories in kcal. n/a: not reported by the source.
Frequently asked questions
How many calories are in mini Nilla Wafers?
100 g of mini Nilla Wafers has 467 kcal. Serving, 20 wafers, 30 g (30 g): about 140 kcal.
How much protein is in mini Nilla Wafers?
Mini Nilla Wafers contains 3.3 g of protein per 100 g (7% of the 50 g Daily Value), or 1 g in serving, 20 wafers, 30 g (30 g). About 3% of its calories come from protein. Compared with other sweets and desserts, that is in the lowest quarter (median 6.5 g).
How many carbs are in mini Nilla Wafers?
Mini Nilla Wafers has 70 g of total carbohydrates per 100 g, including 0 g of fiber and 36.7 g of sugars.
How much fat is in mini Nilla Wafers?
Mini Nilla Wafers contains 20 g of fat per 100 g, of which 5 g is saturated (25% of the Daily Value).
What vitamins and minerals does mini Nilla Wafers contain?
Per 100 g, the most notable amounts relative to the Daily Value are iron (19% DV). The full list is in the vitamins and minerals table above.
How much sodium is in mini Nilla Wafers?
100 g contains 383 mg of sodium, 17% of the 2,300 mg Daily Value.
Where does this nutrition data come from?
From USDA FoodData Central: Branded Foods, record dated March 31, 2026. FoodFactly last checked it on November 7, 2026. Each value above shows whether it was measured, calculated or taken from a label.
Source of the nutrition information
- USDA FoodData Central: Branded Foods, record 1457460. License: CC0 1.0 (U.S. public domain). Source record dated March 27, 2018. Imported November 6, 2026.
- Open Food Facts, record 0044000027353. License: ODbL 1.0 (Open Food Facts). Source record dated March 31, 2026. Imported November 7, 2026.
Last updated: . Data quality score: 100/100 (how it is calculated).
General nutrition information, not medical advice. Individual needs differ; see our disclaimer.