Cheeze Dipped Crunchy Layered Sandwich
Packaged product Snacks Britannia
Cheeze Dipped Crunchy Layered Sandwich contains 492 kcal per 100 g. A serving, 100 g (100 g) provides about 492 kcal.
Roughly 56% of its calories come from carbohydrates, with 38% from fat and 6% from protein (estimated with general energy factors).
That is close to the median for snacks on FoodFactly (457 kcal per 100 g).
The values are as declared on the product label and entered by Open Food Facts contributors.
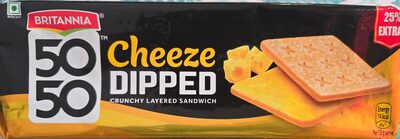
Nutrition facts
| Nutrient | Amount per 100 g | % DV |
|---|---|---|
| Calories L | 492 kcal | |
| Total fat L | 20.7 g | 27% |
| Saturated fat L | 14.1 g | 71% |
| Trans fat L | 0.1 g | |
| Cholesterol L | 3.1 mg | 1% |
| Sodium L | 445 mg | 19% |
| Total carbohydrates L | 68.9 g | 25% |
| Dietary fiber | not reported | |
| Total sugars L | 18.3 g | |
| Added sugars L | 13.9 g | 28% |
| Protein L | 7.6 g | 15% |
% DV: percent of the FDA Daily Value for adults (reference amounts). Letters show how each value was obtained: M measured, C calculated, L label, Z assumed zero, I imputed. Vitamins and minerals not listed were not reported by the source.
Nutritional breakdown
- Protein 6%
- Carbohydrates 56%
- Fat 38%
Approximate share of calories, using general energy factors (4 kcal/g protein and carbohydrate, 9 kcal/g fat, 7 kcal/g alcohol).
Nutritional insights
- Protein7.6 gabove the median for snacks (median 7.5 g)
- Sugars18.3 gabove the median for snacks (median 4.5 g)
- Fat20.7 gbelow the median for snacks (median 20.9 g)
- Saturated fat14.1 gin the top quarter of snacks (median 3.6 g)
- Sodium445 mgabove the median for snacks (median 424 mg)
- Protein per 100 kcal1.5 gprotein density, useful for comparing foods with different calorie levels
Product details
Ingredients
Ingredients not reported.
Similar products
| Food | Calories | Protein | Carbs | Fat |
|---|---|---|---|---|
| Fish N Chips Salt & Vinegar Burtons | 492 | 7.6 g | 56 g | 24 g |
| Schoko Herzen (crispy-schokoladig) Biovegan | 492 | 4.2 g | 60 g | 26 g |
| Potato Crisps Spar | 492 | 4.1 g | 61 g | 25 g |
| Pokki snack Surasang | 492 | 9.2 g | 61.5 g | 24.6 g |
| Snack Mix Better Bites | 492 | 16.4 g | 44 g | 27.2 g |
| Gourmet Popcorn Treats Nanna’s Gingerbread Dr Bug’s | 492 | 3.3 g | 69.7 g | 22 g |
| Cheese Corn Chips Health Magic | 492 | 8.3 g | 65.8 g | 21.6 g |
| Mango And Habanero Potato Chips Hardbite | 492 | 10 g | 49 g | 26 g |
Per 100 g. Calories in kcal. n/a: not reported by the source.
Source of the nutrition information
- Open Food Facts, record 8901063369030. License: ODbL 1.0 (Open Food Facts). Source record dated June 2, 2026. Imported November 12, 2026.
Last updated: . Data quality score: 85/100 (how it is calculated).
Product data from Open Food Facts, made available under the Open Database License. Values are as declared on the label; labels can change over time, so check the package you have.
General nutrition information, not medical advice. Individual needs differ; see our disclaimer.