3 In 1 Strong
Packaged product Other Foods Nescafé
3 In 1 Strong contains 41 kcal per 100 g. A serving, 150 ml (150 g) provides about 62 kcal.
Roughly 71% of its calories come from carbohydrates, with 27% from fat and 2% from protein (estimated with general energy factors).
That is less energy than the typical item in other foods on FoodFactly, where the median is 254 kcal per 100 g across 511,115 products.
The values are as declared on the product label and entered by Open Food Facts contributors.
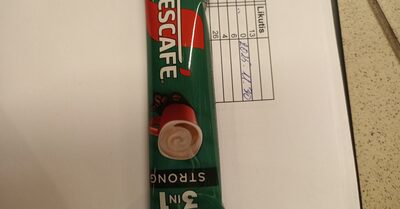
Nutrition facts
| Nutrient | Amount per 100 g | % DV |
|---|---|---|
| Calories L | 41 kcal | |
| Total fat L | 1.2 g | 2% |
| Saturated fat L | 1.1 g | 6% |
| Sodium L | 80 mg | 3% |
| Total carbohydrates L | 7.2 g | 3% |
| Dietary fiber L | 0.4 g | 1% |
| Total sugars L | 5.5 g | |
| Protein L | 0.2 g | 0.4% |
% DV: percent of the FDA Daily Value for adults (reference amounts). Letters show how each value was obtained: M measured, C calculated, L label, Z assumed zero, I imputed. Vitamins and minerals not listed were not reported by the source.
Nutritional breakdown
- Protein 2%
- Carbohydrates 71%
- Fat 27%
Approximate share of calories, using general energy factors (4 kcal/g protein and carbohydrate, 9 kcal/g fat, 7 kcal/g alcohol).
Nutritional insights
- Protein0.2 gin the lowest quarter of other foods (median 7.4 g)
- Fiber0.4 gin the lowest quarter of other foods (median 1.8 g)
- Sugars5.5 gabove the median for other foods (median 3.2 g)
- Fat1.2 gin the lowest quarter of other foods (median 6.6 g)
- Saturated fat1.1 gbelow the median for other foods (median 2 g)
- Sodium80 mgbelow the median for other foods (median 248 mg)
- Protein per 100 kcal0.49 gprotein density, useful for comparing foods with different calorie levels
Product details
- Brand
- Nescafé
- Barcode
- 8445291206878
- Label serving
- 150 ml
- Category
- Other Foods
Ingredients
Ingredients not reported.
Similar products
| Food | Calories | Protein | Carbs | Fat |
|---|---|---|---|---|
| Pepsi Pepsi | 41 | 0 g | 11.1 g | 0 g |
| Transformation Flavored Coca-Cola | 41 | 0 g | 10.8 g | 0 g |
| Absolu Pomme Gingembre Citron paf | 41 | 0.5 g | 9.3 g | 0.5 g |
| Fraise framboise myrtilles Grand frais | 41 | 0.9 g | 6 g | 0.5 g |
| Koktajl woda kokosowa & truskawka Andros | 41 | 0.7 g | 8.3 g | 0.2 g |
| Pepsi-Cola Pepsi | 41 | 0 g | 11 g | 0 g |
| Instant cup' petits pois Delhaize | 41 | 1.4 g | 6.4 g | 0.85 g |
| Jus De Choucroute 750ML Rabenhorst | 41 | 0.7 g | 1.5 g | 0.5 g |
Per 100 g. Calories in kcal. n/a: not reported by the source.
Source of the nutrition information
- Open Food Facts, record 8445291206878. License: ODbL 1.0 (Open Food Facts). Source record dated March 8, 2026. Imported November 12, 2026.
Last updated: . Data quality score: 85/100 (how it is calculated).
Product data from Open Food Facts, made available under the Open Database License. Values are as declared on the label; labels can change over time, so check the package you have.
General nutrition information, not medical advice. Individual needs differ; see our disclaimer.